

Sampling Oscilloscope
DCA4201
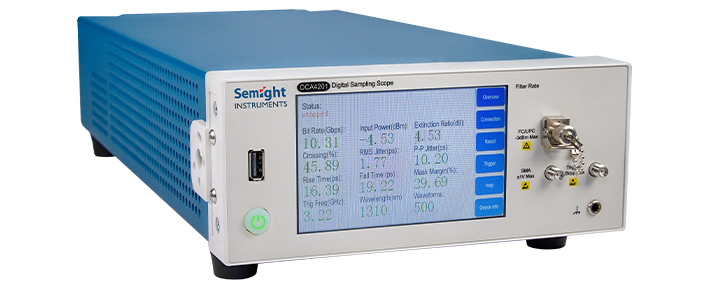
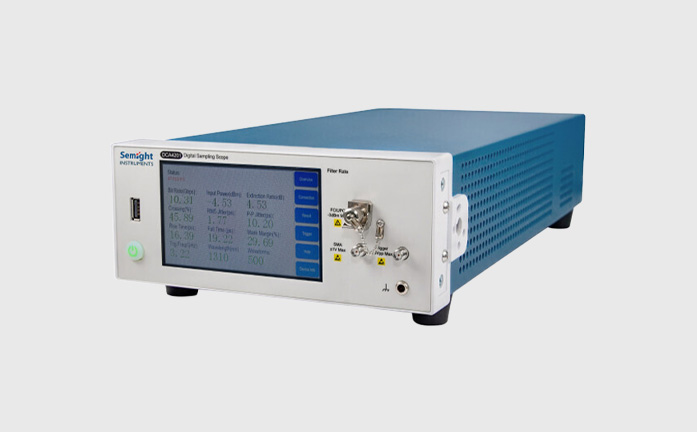
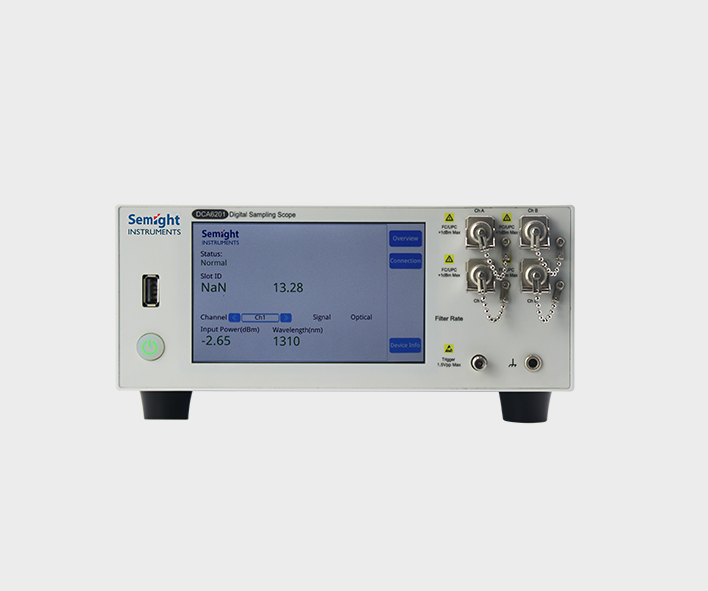
10GHz Sampling Oscilloscope DCA4201
DCA4201 is a sampling oscilloscope, which is designed based on equivalent-time sampling and eye diagram reconstruction technology, it offers a low-cost solution for high-precision measurement of high-speed optoelectronic digital signals.
Features

Fast Sampling
Fast sampling rate 100K
Extinction ratio correction
Support extinction ratio correction
Eye Mask Test
Automatic eye margin testing(Mask Margin)
Standard Filter
Covers 1-12.5 Gbps data ratesFeatures and Benefits
Multi-port integrated design
Small size( about ¼ of traditional sampling oscilloscope), greatly reduces required space.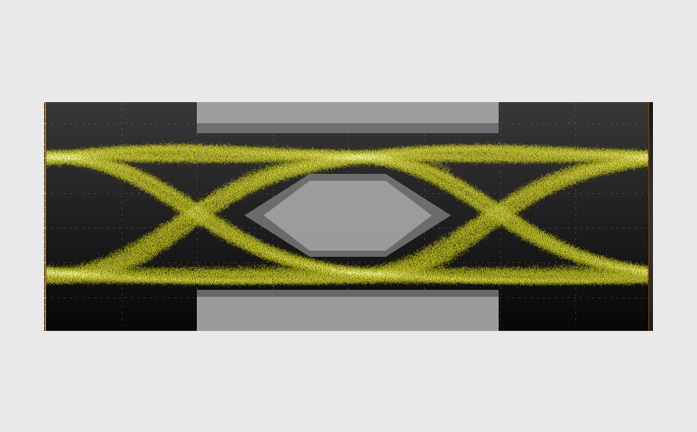
Calibrated reference receiver
Meets industry frequency response tolerances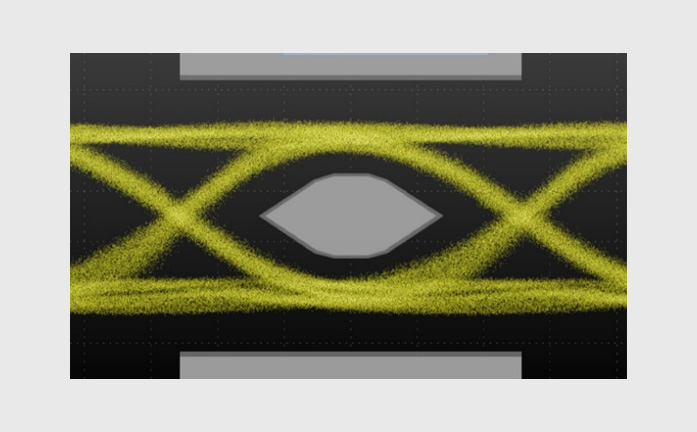
Calibrated reference receiver
Semight DCA4201 sampling oscilloscope(10G)With extinction ratio correction factor/dark current self-calibration and other algorithms,
| Module under test |
RMS Jitter (ps) |
Intersection Crossing (%) |
Rise Time 20%~80% (ps) |
Extinction Ratio (dB) |
Template margin Mask Margin (%) |
|
| DUT1 | Semight DCA4201 | 11.69 | 52.04% | 153.86 | 10.44 | 28.91% |
| Consistency (absolute deviation) | 0.26 | 0.06% | 2.34 | 0.12 | 1.20% | |
| Consistency (relative deviation %) | 2.27% | -0.12% | -1.50% | -1.14% | 4.37% | |
| DUT2 | Semight DCA4201 | 7.73 | 50.30% | 149.56 | 11.31 | 40.63% |
| Consistency (absolute deviation) |
-0.1 | 0.06% | 2.34 | 0.12 | 1.20% | |
| Consistency (relative deviation %) |
-1.28% | -0.20% | -3.76% | -2.25% | 3.65% |
| Optical Channel Specifications | |
| Wavelength Range | 850~1650 nm |
| Calibrated Wavelengths (OE conversion gains) | 850/1310/1550 nm |
| Filters | |
| DCA4201-140 |
GPON,1.244 Gbps 1Gb Ethernet,1.250 Gbps, CPRI 1.229 Gbps |
| DCA4201-160 |
OC-48/STM-16,2.488 Gbps, 2 Gb Ethernet,2.500 Gbps, CPRI 2.458 Gbps |
| DCA4201-180 |
10Gb Ethernet LX-4,3.125 Gbps, CPRI 3.072 Gbps |
| DCA4201-200 | CPRI 6.144 Gbps,6.25 Gbps |
| DCA4201-100 | OC-192/STM-64,9.953 Gbps, 10Gb Ethernet,10.3125 Gbps, 10×Fibre Channel,10.51875 Gbps, OC-192/STM-64 FEC,10.664 Gbps , OC- 192/STM-64 FEC,10.709 Gbps, 10Gb Ethernet with FEC,11.0957 Gbps, 10×Fibre Channel with FEC,11.317 Gbps |
| Electrical Specifications | |
| Electrical channel bandwidth | 20 GHz (typ.) |
| Rise Time(10%~90%) | 20 ps |
| Max Input Amplitude | <1 V |
| RMS noise | <2 mV (typ.) |
| Electrical Sensitivity | 24 mV |
| Reflection | 10% |
文档下载
 DCA4201 Quick Start Guide_G2 DCA4201 TCP远程控制使用说明DCA上位机简要使用说明
Similar recommendation
Optical communication network plays an important role in the rapid development of big data, cloud computing, 5G communication and other markets.
Semight offers various of instruments for optical Transceiver/Component testing, including wide bandwidth sampling oscilloscope, NRZ/PAM4 bit error ratio tester , burst error ratio tester, fast wavelength meter, optical spectrum analyzer, high precise source measure unit, 400G network analyzer ,optical power meter, optical attenuator, optical switch etc. Provide cost-effective complete solutions.
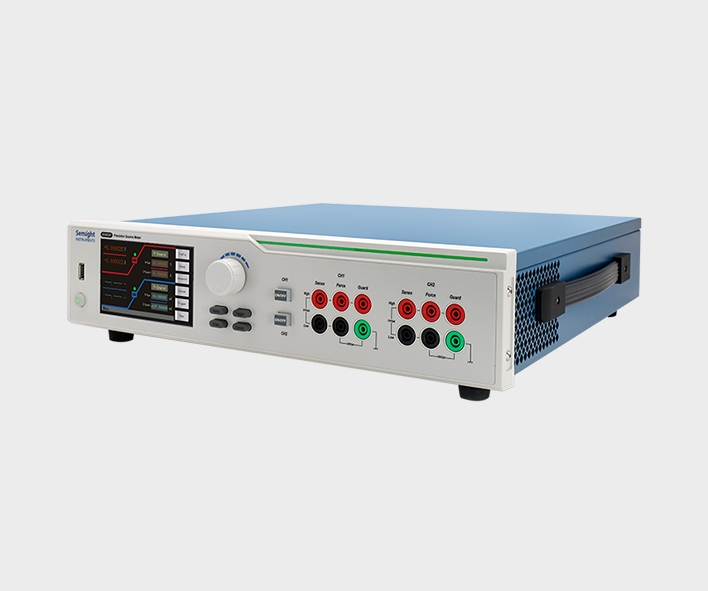
The high-precision source meter integrates the functions of voltage source, current source, voltmeter, ampere meter, and electronic load in one, which is widely used in high-precision IV test and measurement for various discrete components, photovoltaic, new energy, battery and other industries. Semight Instrument provides high-precision benchtop source meters and plug-in PXIe source meter modules of standard PXIe chassis, fully meeting the application of various test scenarios.
Details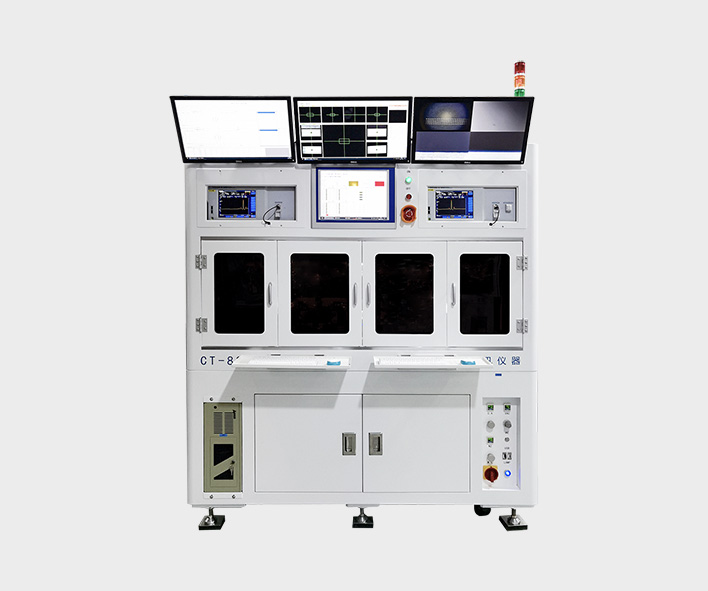
Burn-in testing of laser is an important method to ensure the reliability of laser. Through the test of COC or bare die, the early failure of laser caused by the defects in the process of laser production can be screened out in advance. Semight Instrument provides a complete solution from bare die to COC, from high temperature(150℃ or higher) to low temperature (-40℃), with CoC automatic loading and unloading system, forming a complete test solution, Semight Instrument's laser chip burn-in/load/unload test system has been widely recognized by the market.
Details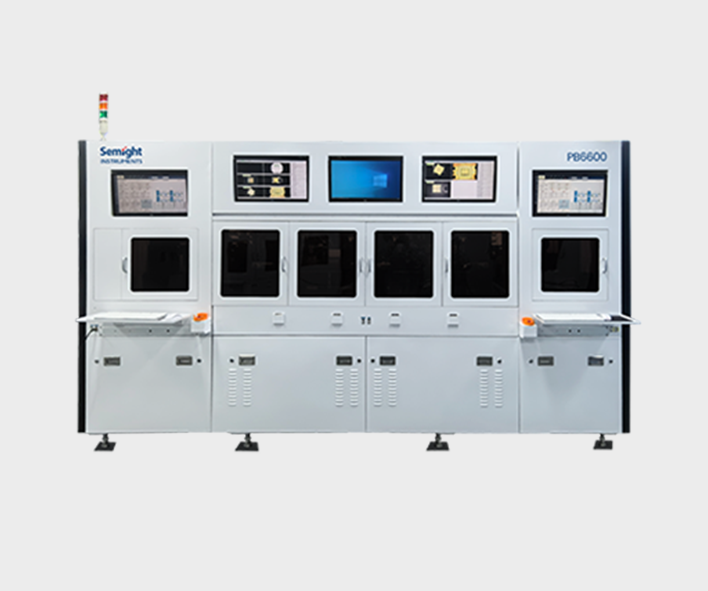
The semiconductor front-end test is mainly used in the wafer processing to check whether the processing parameters of the wafer products meet the design requirements or there are defects affecting the yield after each step of the manufacturing process. The semiconductor back-end test equipment is mainly used after wafer processing to check whether the performance of the chip meets the requirements, which belongs to the electrical performance test. Semight Instrument provide integrated solutions such as wafer burn in and known good die tester, improve test efficiency and reduce test cost.
DetailsService hotline
Follow
Name
Email verfication code
Phone
Password
Confirm Password
e-mail address
Email verification code
New Password
Confirm Password
 Ask for demo